Wow, that title sounds a little click-baity. Maybe I should start my own YouTube channel telling everyone what to think! Instead, I'll just deliver information, in the following handy chart. You'll need to click through to see a larger version. And read on for an explanation.

I read interminable debates about which zoom lens to purchase/use. When it comes to Panasonic these all have similar handling and good image quality. So the distinguishing characteristics are a) the maximum aperture, and b) their size and weight, and c) the range they cover. Here's a list of the currently available zooms:
- Lumix S Pro 14-28mm f/4-5.6
- Lumix S Pro 16-35mm f/4
- Lumix S 20-60mm f/3.5-5.6
- Lumix S Pro 24-70mm f/4
- Lumix S Macro 24-105mm f/4
- Lumix S Pro 70-200mm f/4
- Lumix S Pro 70-200mm f/2.8
- Lumix S 70-300mm f/4.5-5.6
The "Pro" line have a fixed aperture across their focal length range, but are more expensive, larger, and heavier. I'll go out on a limb and say that in practice there's little difference between a fixed f/4 and a variable aperture, since we have tons of usable ISO to make up the exposure, and neither f/4 nor f/5.6 makes much difference in terms of depth of field. (The singular f/2.8 zoom is a different matter.)
So let's for now consider only focal lengths. What's the best way to compare these? My argument is that the focal length in millimeters is the wrong way. Because focal length is a secondary characteristic when actually taking photos.
What's more important? How much of the field in front of you the lens frames. The Field of View (FoV) AKA angle of view tells you how wide your vista will be. And that's important not only for what fits into the frame, but for how objects are rendered in relationship to distance. (That's a different article.)
So here's that same lens list, replacing focal length with diagonal FoV. These are the numbers on Panasonic's spec sheets. They may not be the actual measured FoVs... but no-one actually tests this any more. (They should.)
- Lumix S Pro 114-75°f/4-5.6
- Lumix S Pro 107-63°f/4
- Lumix S 90-40°f/3.5-5.6
- Lumix S Pro 84-34°f/4
- Lumix S Macro 84-23°f/4
- Lumix S Pro 34-12°f/4
- Lumix S Pro 34-12°f/2.8
- Lumix S 34-8.3°f/4.5-5.6
That will look pretty strange for anyone used to reading lens stats. But look what this new perspective (sorry, hard to avoid puns) tells us. The telephoto lenses have much bigger numbers for focal length and so appear as though they cover a larger range... but they don't. They have a smaller difference between their close and far FoVs than the wider lenses.
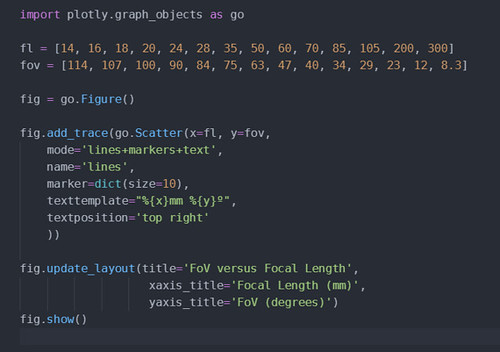
Now we come to that graph at the top of the article. It's pretty clear that there's a smooth relationship between FoV and focal length, but this is not a linear curve. We get more "bang for the buck" at the wider end of the spectrum.
Now for a practical application of this knowledge. It's common to read people recommending that a good replacement for the kit lens, the Lumix S 20-60mm f/3.5-5.6, is a 24-70mm zoom. A naive photographer might think, "Hmmm, giving up only 4mm on the wide end but gaining 10mm on the tele end. Nice!"
But from now on I want you to compare the kit FoV range of 90-40°with the potential replacement, 84-34°. Both actually have the same 50° range. But is it better to have access to 6° more on the wide end or 6° more on the tele end? The extra width makes the lens more versatile for interiors, group shots, architecture, etc. Whereas you can compensate for the difference between 40° and 34° by stepping one pace closer to your subject. You can't take one step backwards if there's a wall behind you.
Start thinking in FoV and make better decisions.
A note for other systems
The data here applies to any so-called full-frame (135). I gathered focal length data for each fixed prime lens in the Panasonic Lumix S line-up, and included the short and far extremes of each zoom. I decided not to incorporate third-party lenses, but leave this as an exercise for the reader.
If you are on APS-C, MFT, or some other sensor size, the numbers will differ. But exactly the same thinking applies.
How I made the graph
Not liking any of the available plotting tools, I wrote some Python code. This uses the Plotly library, which is open source and free. The result is an interactive graph on an HTML page, which is nice!
There is also a library to produce a fixed image, but this kept hanging with no error. So instead I grabbed a screen shot. Here's the code. It took me a while to figure out how to display labels for each data point.
No comments:
Post a Comment